MTF Bollinger BandWidth [CryptoSea]The MTF Bollinger BandWidth Indicator is an advanced analytical tool crafted for traders who need to gauge market volatility and trend strength across multiple timeframes. This powerful indicator leverages the Bollinger BandWidth concept to provide a comprehensive view of price movements and volatility changes, making it ideal for those looking to enhance their trading strategies with multi-timeframe analysis.
Key Features
Multi-Timeframe Analysis: Allows users to monitor Bollinger BandWidth across various timeframes, providing a macro and micro perspective on market volatility.
Pivot Point Detection: Identifies crucial high and low pivot points, offering insights into potential support and resistance levels. Pivot points are dynamic and adjust based on the timeframe viewed, reflecting short-term fluctuations or longer-term trends.
Customizable Parameters: Includes options to adjust the length of the moving average, the standard deviation multiplier, and more, enabling traders to tailor the tool to their specific needs.
Dynamic Color Coding: Utilizes color changes to indicate different market conditions, aiding in quick visual assessments.
In the example below, notice how changes in BBW across different timeframes provide early signals for potential volatility increases or decreases.
How it Works
Calculation of BandWidth: Measures the percentage difference between the upper and lower Bollinger Bands, which expands or contracts based on market volatility.
High and Low Pivot Tracking: Automatically calculates and tracks the pivots in BBW values, which are critical for identifying turning points in market behavior. High and low levels will change depending on the timeframe, capturing distinct market behaviors from granular movements to broad trends.
Visual Alerts and Table Display: Highlights significant changes in BBW with visual alerts and provides a detailed table view for comparison across timeframes.
In the example below, BBW identifies a significant contraction followed by an expansion, suggesting a potential breakout.
Application
Strategic Market Entry and Exit: Assists traders in making well-informed decisions about when to enter and exit trades based on volatility cues.
Trend Strength Assessment: Helps in determining the strength of the prevailing market trend through detailed analysis of expansion and contraction periods.
Adaptable to Various Trading Styles: Suitable for day traders, swing traders, and long-term investors due to its customization capabilities and effectiveness across different timeframes.
The MTF Bollinger BandWidth Indicator is a must-have in the arsenal of traders who demand depth, accuracy, and responsiveness in their market analysis tools. Enhance your trading decisions by integrating this sophisticated indicator into your strategy to navigate the complexities of various market conditions effectively.
Wyszukaj w skryptach "pivot points"

XXPivotsBreakoutsLibrary "XXPivotsBreakouts"
Utilizes k-NN machine learning to predict breakout zones from pivot points, aiding traders in identifying potential bullish and bearish market movements. Ideal for trend-following and breakout strategies.
breakouts(pivotBars, numNeighbors, maxData, predictionSmoothing)
Detects and predicts breakout points from pivot data.
Parameters:
pivotBars (int) : int: Number of bars for pivot point detection.
numNeighbors (int) : int: Neighbors count for k-NN prediction.
maxData (int) : int: Maximum pivot data points for analysis.
predictionSmoothing (int) : int: Smoothing period for predictions.
Returns: : Lower and higher prediction bands plus pivot signal, 1 for ph and -1 for pl.

ZigZag With ATR Filter [vnhilton](OVERVIEW)
The typical ZigZag indicator, which connects pivot points (see TradingView's Help Center regarding their indicator Pivot Points High Low, for an in depth explanation on how they are calculated) with lines, except instead of a percentage threshold, it uses ATR which adjusts for volatility of the ticker you are viewing. The ZigZag indicator can therefore be used to help visualise price legs and trends on a usually noisy looking chart.
(FEATURES)
- Toggles for pivot point label contents such as the value, the trend, or nothing at all.
- ATR and pivot point periods.
- ATR multiplier minimum threshold to plot pivots and draw lines only when this threshold is met (helps eliminate small, perhaps insignificant price movements, to have a better focus on the overall trend).
- Show the last 2 to 499 ZigZag lines.
- Uptrend, downtrend and range colors for high and low pivot labels, text labels and lines, for both confirmed and real-time plots.
- Label size, and label styles for the high and low pivots.
- Customisable width and styles (Arrow Right, Dashed, Dotted, Solid) for the ZigZag line.
In the main chart picture, labels show both the pivot point value and the trend at that point. In the picture above, on the left shows only the pivot point value, the right shows only the trend.
Picture above shows just the label with 0 contents. Also notice the last recent line being blue instead of green. This is because the current bar hasn't finished so this line is currently live and not confirmed, so is subject to change. Keep in mind even if a pivot point is confirmed, it can be updated by a subsequent higher high/lower low.
Left chart shows a minimum ATR threshold multiplier of 1x; Right chart has 2x ATR minimum threshold. Notice the left chart highlights more price legs as more price legs satisfy a less strict threshold.

Zigzag Tails [Trendoscope®] 🎲 Introducing Zigzag Tails Indicator by Trendoscope.
The Zigzag Tails Indicator, a groundbreaking tool from Trendoscope, redefines technical analysis by seamlessly integrating anchored VWAPs (Volume Weighted Average Prices) and Average Price calculations with Zigzag pivot points. This advanced indicator recalculates Average Price or VWAP from one Zigzag pivot to the next, offering unparalleled insights into market movements.
🎯 Innovative Design
Each Zigzag pivot can feature up to three distinct tails, corresponding to the high, low, and close prices of each candle. Users have the flexibility to select between Average Price and VWAP for display on their charts. By default, the indicator plots all three tails, but individual tail visibility is customizable via the settings panel.
Average Price Mode: When selected, tails depict the average price across a specified number of bars.
VWAP Mode: In this mode, tails represent the VWAP, calculated for a given price over a set number of bars.
🎯 Dynamic Dotted Tail
The Zigzag Tails Indicator features dotted tails that extend from the last Zigzag pivot to the current bar. These dotted tails dynamically adapt to market changes and are subject to repainting with the emergence of new Zigzag pivots.
When repainting is enabled, the dotted tails originate from the last unconfirmed Zigzag pivot, extending to the current bar. This setting offers a more immediate, albeit tentative, visual representation of market trends.
With repainting disabled, the dotted tails will be anchored from the last confirmed Zigzag pivot to the current bar, providing a more stable but slightly delayed market analysis.
Irrespective of the repaint option, the dotted dynamic tails is always expected to repaint.
🎯 Practical Applications
The Zigzag Tails Indicator provides more accurate support and resistance levels than traditional VWAP, rolling VWAP, or moving averages. Its precision makes it an invaluable tool for identifying trends, as well as potential trend continuations or reversals.
🛠 Indicator Settings
Zigzag Configuration:
Zigzag Length determines the loopback length for the foundational Zigzag calculation.
Number of Bars represent the calculation distance. This limitation is added to avoid runtime errors on lower timeframes. The calculations run through lots of loops. Hence, if it is run across too many bars, we may get timeout issues.
Repaint: Activating this will also display the last, unconfirmed Zigzag pivot. Since the last pivot is inherently tentative, it may repaint with the arrival of new bars. A pivot is confirmed only when a subsequent unconfirmed pivot emerges on the chart.
Tail Configuration
Tail Type: Choose between average and VWAP for the tail calculation. The average option plots a simple average, while the VWAP option calculates an anchored VWAP from pivot to pivot.
Display Options: Tailored display options for High, Low, Close prices, with customizable colors for each tail type.
Inspired by the ideas of @KioseffTrading's implementation of Zigzag Anchored VWAP

Mobius - Trend Pivot// Mobius
// V01.01.29.2019
// Uses trend of higher highs with higher lows and trend of lower lows with lower highs to locate pivots. Distance for trend is set by the user. Confirmation of a reversal from pivots is set with a multiple of the pivot bars range. That multiple is also a user input.
// Trading Rules
// 1) Trade when price crosses and closes outside the pivot Confirmation line. At that point looking for best entry. Min trade is 2 contracts
// 2) Know your risk point before entering trade. Typical risk point is the pivot line itself. If your risk is crossed look for an exit. Never use hard stops - you'll often get out for little or no loss
// 3) Know your Risk off point before entering. Typical Risk Off is an ATR multiple. Offer Risk Off as soon as possible for a Risk Free trade
// 4) set mental stop one tick above entry when Risk Off is achieved
// 5) if trade continues your way move mental stop for your runner to last support / resistance each time a new support / resistance is hit.
The script is an indicator called "Mobius - Trend Pivot" and is designed to be overlaid on price charts. It utilizes a concept called "Mobius - Trend Pivot" to identify potential reversal points in the market based on the trend of higher highs with higher lows and lower lows with lower highs. The user can adjust the parameters through input variables. The script expects two inputs: "n" and "R_Mult." The "n" input determines the distance for trend calculation, and the "R_Mult" input is used for confirming a reversal from the pivots. The script calculates the True Range, which is the maximum of the current bar's high minus the previous bar's close or the previous bar's close minus the current bar's low. It then identifies the highest high (hh) and lowest low (ll) based on the trend criteria using the input variable "n." The script plots lines representing the pivot points, their confirmation levels, and risk-off levels. It also generates alerts when the price crosses above or below the confirmation or risk-off levels. Additionally, it plots shapes (arrows) on the chart to indicate bullish or bearish conditions based on the crossover or crossunder of the price with the pivot levels.

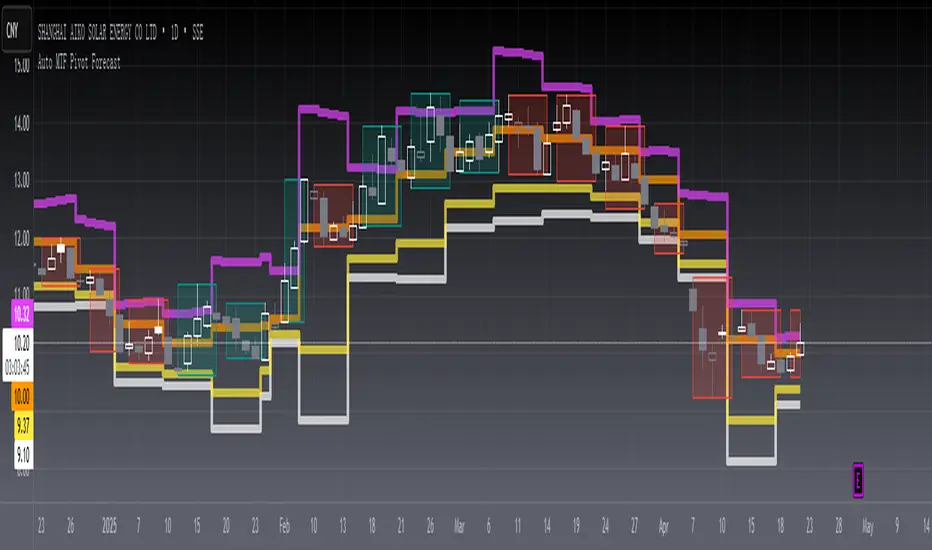
[blackcat] L2 Auto MTF Pivot Forecast Level 2
Background
A algo for pivot points forecast for each bar of automatic multiple timeframe (MTF) data.
Function
In financial markets, a pivot point is a price level that is used by traders as an indicator of market movement. Pivot points are averaged from important prices (highest, lowest, closing) based on the market performance of the previous time period. There are many ways to calculate the pivot point. The pivot point is calculated using the highest price (H), the lowest price (L) and the closing price (C) of the previous time period, and sometimes the opening price of the current time period Valence (O) was added to it.
S1 yellow
S2 white
R1 Orange
R2 fuchsia
The smoothing parameter default to 55
The pivot point indicator can be used in two ways. First, the pivot point can be used as a price trend confirmation. It is generally believed that if the price is above the pivot point in the latter period of time, the market is considered to be in a bull market sentiment, otherwise it is considered to be in a bear market sentiment. Second, support and resistance levels are mainly used as exit positions. For example, R1 and R2 can be used as trade targets if the market price breaks above a pivot point. If the market effectively breaks R1 and R2, traders may consider adding to their long positions.
Remarks
Feedbacks are appreciated.
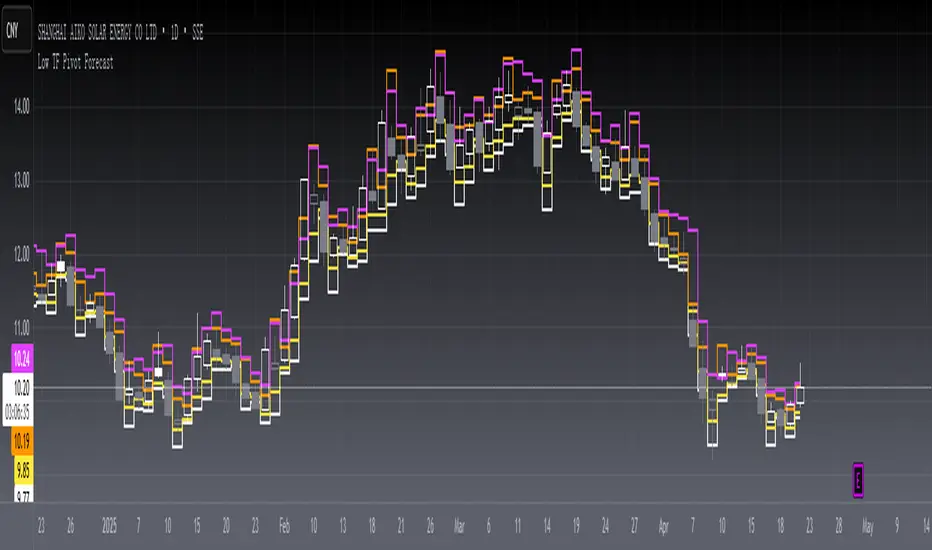
[blackcat] L2 Low TF Pivot Forecast Level 2
Background
A algo for pivot points forecast for each bar and its low tf data.
Function
In financial markets, a pivot point is a price level that is used by traders as an indicator of market movement. Pivot points are averaged from important prices (highest, lowest, closing) based on the market performance of the previous time period. There are many ways to calculate the pivot point. The pivot point is calculated using the highest price (H), the lowest price (L) and the closing price (C) of the previous time period, and sometimes the opening price of the current time period Valence (O) was added to it.
S1 yellow
S2 white
R1 Orange
R2 fuchsia
The smoothing parameter default to 55
The pivot point indicator can be used in two ways. First, the pivot point can be used as a price trend confirmation. It is generally believed that if the price is above the pivot point in the latter period of time, the market is considered to be in a bull market sentiment, otherwise it is considered to be in a bear market sentiment. Second, support and resistance levels are mainly used as exit positions. For example, R1 and R2 can be used as trade targets if the market price breaks above a pivot point. If the market effectively breaks R1 and R2, traders may consider adding to their long positions.
Remarks
Feedbacks are appreciated.
Daily Reference Points for Intra-hour ChartsI worked with pivot script which I believe was created by @HPotter but somehow, I can't look it up.
This script fixes one issue I have with several pivot points script I had honour to see. When the new day starts, sometimes, there is a line connecting old pivot points and new ones. I managed to remove it.
Compared to the script I worked with, I converted the code from v.1 to v.4, added middle pivots and added previous day's close, high and low which are superior levels compared to any pivot calculation.
This script will show only on the 1m, 5m, 15m and 30m charts, so you don't need to turn it off when you check higher timeframe for macroanalysis.
(JS) Multi-Time Frame Pivot Point Detector 2.0So here's an updated version of my automatic Pivot Point detector.
If you don't like having a bunch of Pivots on your chart at once, or having to cycle through various resolutions to see different ones, this is for you!
What does this indicator do? It automatically detects the nearest daily, weekly, and monthly pivot points both above and below the current price and automatically plots them for you. It's really just as simple as that.
You select how far back you want it to plot with the "Pivot Point Look Back Period" option.
I also have transparency options for each type of pivot so its easy to find the opacity you prefer and save it as a default setting.
With "Turn Off Each Pivot Point On All Time Frames" turned on, as an example, if you were to uncheck "S1/R1" then it turns S1/R1 plots off across all 3 pivot resolutions. By default however, I have it set where you can pick and choose each one individually.
I also added the default "VWAP Periodic" script from TradingView in there with it (not in prior version). This works identical to the built in indicator (because it is identical).
Trading algorithms like to target pivot points and liquidity, so I figured they would pair together nicely for active trading.

Significant PP - Swing Failure / Stop Run Alerts [QN]Tried to create a script for Swing Failure / Stop Run patterns. It is based on my QuantNomad - "Significant Pivot Reversal" Indicator.
It's quite tricky to code these kinds of patterns, so it's really not ideal. I alert when a candle cross pivot level but close below (above for bottom) it and previous close was below (above) it as well.
You can setup params for pivot points and also by how much it should cross pivot level with "SF ATR Mult".
I have in mind a few other things I'd like to test:
* Different types of pivot points
* Few recent pivot levels at once
* Pivots from higher timeframe
* Different types of "touching" levels
* etc.
Ideally, I want to create a strategy from it, but I'm far from it for now.
Do you have any ideas on how to make it better?
Original Significant Pivot Reversal Indicator:

Pivot Hilo Support n Resistance Levels R3-3 by JustUncleLThis is an update to the "Pivot HiLo Support n Resistance Levels" indicator, important updates are no re-painting; and different lengths available for each side of Pivot.
Description:
The Pivot Points are marked with "star" and with Optional Support and Resistance extension Levels shown.
Options:
Show Pivot Points (default true)
Pivot Length Left Side (default 7), the number of bars left hand side of the Pivot candle.
Pivot Length Right Side (default 3), the number of bars right hand side of the Pivot candle.
Show S/R Extension Levels (default true)
Maximum S/R Extension Length (default 0, no limit)
Show Pivot Labels (instead of "star") " " and " "
Revisions this release:
Added code to force Pivot to be always complete before drawing.
Added option for different length test for each side of Pivot.
Pullback Trading Tool R5-65 by JustUncleLBy request this is an updated version of the "PullBack Trading Tool": removes experimental "OCC" channel, added option to display ribbons or just single moving average lines, added alert arrows for "PB" exits, added alertcondition for TV alarm subsystem, added some extract options for Pivot points and general cleanup of code.
Description:
This project incorporates the majority of the indicators needed to analyse and trade Trends for Pullbacks, swings and reversals.
Incorporated within this tool are the following indicators:
1. Major industry (Banks) recognised important EMAs in an EMA Ribbon:
Lime = EMA5 (Optional Display)
DodgerBlue = EMA12 (Optional Display)
Red = EMA36 (Optional display)
Green = EMA89
Blue = EMA200
Black = EMA633
2. The 5 EMA (default) High/Low/Close Price Action Channel (PAC), the PAC channel display is disabled by default.
3. Optionally display Fractals and optional Fractal levels
4. Optional HH, LH, LL, HL finder.
5. Optional Buy/Sell "PB" exit Alerts with Optional 200EMA filter.
6. Coloured coded Bar high lighting based on the PAC:
blue = bar closed above PAC
red = bar closed below PAC
gray = bar closed inside PAC
7. Alert condition sent to TradingView's Alarm subsystem for PB exits.
8. Pivot points with optional labels.
9. EMA5-12 Ribbon is displayed by default.
10.EMA12-36 Ribbon is displayed by default
Set up and hints:
I am unable to provide a full description here, as Pullback Trading incorporates a full trading Methodology, there are a number of articles and books written on the subject.
Set the chart to Heikin Ashi Candles (optional).
I also add a "Sweetspot Gold R3" indicator to the chart as well to help with support and resistance finding and shows where the important "00" lines are.
First on a weekly basis say Sunday night or Monday morning, analyse the Daily and Weekly charts to establish overall trends, and support/resistant levels. Draw significant mini trend lines (2/3 TL), vertical trend lines (VTL) and S/R levels. Can use the Pivots points to guide VTL drawing and Fractals to help guide 2/3 TL drawing.
Once the trend direction and any potential major reversals highlighted, drop down to lower timeframe chart and draw appropriate mini Trend line (2/3 TL) matching the established momentum direction. Take note of potential pull backs from and of the EMAs, in particular the EMA5-12 ribbon, EMA12-36 Ribbon and the 200EMA. Can use the Pivots and/or Fractals points to guide your 2/3 TL drawing.
Set a TradingView alarm on the "PBTOOL alert", with the default settings this normally occurs before or during the Break of the manually drawn TL lines.
Once alerted check to see if the TL is broken and is returning to trend away from the EMA lines, this is indicated by bar colour change to trend directional colour.
You can trade that alert or drop down to even lower time frames and perform the same TL analysis there to find trades at the lower TF. Trading at lower TF you will allow tighter Stop loss settings.
Other than the "SweetSpot Gold R3" indicator, you should not need any other indicator to successfully trade trends for Pullbacks and reversals. If you really want another indicator I suggest a momentum one for example: AO ( Awesome Oscillator ), MACD or Squeeze Momentum.

CM_Pivot Points Daily To IntradayNew Pivots Indicator With Options for Daily, 4 Hour, 2 Hour, 1 Hour, 30 Minute Pivot Levels!
Great for Forex Traders! - Take a Look at Chart with Weekly, Daily, and 4 Hour levels. Weekly Pivots Indicator is separate - Link is Below.
Plot one Pivot Level or Multiple at the Same Time via Check Boxes in the Inputs tab.
Defaults to 4 Hour Pivot Levels - Adjust in Inputs Tab.
S3 and R3 are turned off by Default - You can Activate Them In The Inputs Tab.
These Intraday Options were Requested By Users Using My CM_ Pivots Point Custom Indicator that Plots Daily, Weekly, Monthly, Quarterly, and Yearly Pivot Levels. Link is Below.
Now Both Longer-Term Traders and Shorter Term Traders Have All The Pivot Levels They Need. From Yearly Levels All The Way Down to 30 Minute Levels!
***The Candles On The Chart Are Custom Heikin-Ashi Paint Bars. Link is Below
CM_ Pivot Points Custom
Daily, Weekly, Monthly, Quarterly, Yearly Pivot Levels
Heikin-Ashi Paint Bars

Trend lines & Pressure Zone Overview
This indicator intelligently identifies and plots dynamic support and resistance zones based on swing pivots and price action validation. It combines trend analysis with pressure zone detection to highlight key areas where price is likely to react.
Key Features
1.Smart Zone Detection
Automatically identifies the strongest resistance and support levels
Requires multiple price touches for validation (configurable)
Plots only the 2 most relevant trendlines to keep charts clean
Dynamic channel zones show the area of influence around each trendline
2.Dual Analysis Method
Uses swing pivot detection to find turning points
Validates zones through touch counting with price margin tolerance
Combines aspects of trendline analysis and pressure zone theory
Adapts to different timeframes and instruments
3.Contact Detection & Alerts
Visual circle markers when price contacts zones
Arrow indicators for zone interactions
Alert conditions for zone creation, breaks, and contacts
Customizable visual feedback
4.Flexible Configuration
Adjustable swing length for pivot detection
Configurable price margin tolerance
Minimum touch requirements prevent false signals
Optional line extension with custom length
Peak reset interval to refresh zones periodically
How It Works
Resistance Zones:
Identifies swing high pivots
Tracks the highest peak within the reset interval
When price drops below the peak, draws a downward trendline
Validates the zone by counting touches within the price margin
Only displays the zone after minimum touches are confirmed
Support Zones:
Identifies swing low pivots
Tracks the lowest trough within the reset interval
When price rises above the trough, draws an upward trendline
Validates the zone by counting touches within the price margin
Only displays the zone after minimum touches are confirmed
Zone Channels:
Each trendline includes a parallel channel showing the pressure zone width, making it easier to identify when price is interacting with the zone.
Pivot Detection:
Swing Length (default: 5) - Bars on each side to confirm pivot points
Peak Reset Interval (default: 100) - Bars before resetting tracked peak/trough
Zone Settings:
Price Margin % (default: 0.1%) - Tolerance for touch validation
Minimum Touches (default: 3) - Required touches before drawing zone
Channel Width % (default: 0.5%) - Visual width of pressure zone
Extension:
Extend Lines (default: off) - Project lines into the future
Extension Length (default: 50) - Bars to extend when enabled
Visual Styling:
Separate color/width controls for resistance and support
Customizable fill transparency for channels, Toggle contact arrows and circles
Trading Applications
Entry Signals:
Buy when price contacts support zone with confirmation
Sell when price contacts resistance zone with confirmation, Look for zone breaks as momentum signals
Stop Loss Placement:
Place stops beyond the opposite zone, Use channel width to gauge volatility
Target Setting:
Opposite zone acts as first profit target, Zone breaks signal potential trend continuation
Confluence:
Works well with volume analysis,Combine with RSI/MACD for confirmation,
Use multiple timeframes for stronger signals
Best Practices
✅ DO:
Adjust swing length based on timeframe (lower for intraday, higher for daily+)
Reduce minimum touches (2-3) for volatile markets
Increase price margin for choppy conditions
Wait for candle close confirmation on zone breaks
❌ DON'T:
Trade zones in isolation without other confirmation
Use overly tight parameters that generate false signals
Ignore the broader trend context
Chase price after zone breaks without pullback
Tips for Optimization
Scalping (1-5 min): Swing Length: 3-5, Min Touches: 2
Day Trading (15-60 min): Swing Length: 5-10, Min Touches: 3
Swing Trading (4H-Daily): Swing Length: 10-20, Min Touches: 3-4
Position Trading (Daily-Weekly): Swing Length: 15-25, Min Touches: 4-5
Alert Conditions
Zone Contact: Price touches resistance or support zone
Set up notifications for real-time trading opportunities
Disclaimer: This indicator is for educational and informational purposes only. It should not be considered financial advice. Always perform your own analysis and risk management before trading.

byquan RSI Divergence (OB/OS + RSI MA Base)byquan RSI Divergence (OB/OS + RSI MA Base)
Description
byquan RSI Divergence is a technical analysis indicator designed to visualize RSI-based divergence patterns within clearly defined overbought and oversold zones, enhanced with an optional RSI moving average baseline.
The script focuses on structural divergence detection rather than signal prediction, providing visual reference points to help users study momentum behavior and price–oscillator relationships.
This indicator is intended for educational and analytical purposes only.
Conceptual Overview
The core idea of this indicator is based on a widely accepted technical principle:
When price structure and momentum structure diverge, market behavior may be transitioning rather than continuing impulsively.
Instead of reacting to every fluctuation, this script identifies well-defined divergence formations that occur:
At RSI pivot points
Within controlled lookback ranges
Inside overbought or oversold zones
Indicator Components
1. RSI Oscillator
The indicator uses a standard Relative Strength Index (RSI):
User-defined period
User-defined source price
RSI values are plotted directly in the pane for transparency and clarity.
2. RSI Base Moving Average
An optional RSI baseline is calculated using a selectable moving average type:
SMA
EMA
RMA
WMA
This baseline is intended to provide additional context for momentum direction and smoothing, not as a signal trigger.
3. Overbought / Oversold Zones
Customizable horizontal levels define:
Overbought conditions
Oversold conditions
Divergences are evaluated only when RSI is located inside the corresponding zone, helping reduce irrelevant signals.
4. Pivot-Based Divergence Detection
The script detects RSI pivot highs and lows using configurable left/right lookback values.
Based on these pivots, it evaluates four divergence types:
Regular Bullish Divergence
Hidden Bullish Divergence
Regular Bearish Divergence
Hidden Bearish Divergence
Each divergence type is plotted independently and can be enabled or disabled by the user.
5. Lookback Range Control
To avoid excessive or outdated comparisons, divergence evaluation is constrained within a user-defined bar range.
This helps ensure that only structurally relevant divergences are displayed.
Visualization
Divergence lines are plotted directly on the RSI pane
Labels are used to distinguish divergence types
Regular and hidden divergences are visually differentiated using color transparency
The indicator prioritizes clarity and interpretability over signal density.
Alert Logic
An alert condition is provided when any divergence type is detected.
Alerts are informational and do not imply direction, timing, or outcome.
Intended Use
This indicator is designed to be used as:
A momentum structure study tool
A visual divergence reference
A supporting component within broader technical analysis
It is not intended to:
Predict market tops or bottoms
Serve as a standalone trading system
Provide financial or investment advice
Technical Notes
The script uses pivot-based confirmation and therefore does not repaint
All calculations are deterministic and rule-based
Divergences are identified only after pivots are confirmed
Results may vary across assets and timeframes
Attribution & Transparency
This script represents a custom implementation and adaptation of commonly documented RSI divergence techniques, including:
Pivot-based divergence logic
Overbought / oversold filtering
RSI smoothing via moving averages
These concepts are widely used in technical analysis.
The specific parameterization, visualization, and filtering structure reflect a personal analytical approach, without claiming exclusivity over the underlying methods.
Disclaimer
This indicator is provided for educational and analytical purposes only.
It does not constitute financial advice, trading recommendations, or performance guarantees.
Past behavior does not imply future results.

Order Blocks+swl - Dual MTF Fixed ExtendedOrder Blocks+SWL - Dual MTF with Swing Validation
Overview
This advanced TradingView indicator combines Multi-Timeframe Order Block detection with Swing High/Low validation to identify high-probability supply and demand zones. The tool displays order blocks from higher timeframes and current timeframe, then highlights those that align with swing points for enhanced reliability.
🔧 Key Features
Multi-Timeframe Order Block Detection
- Current Timeframe: Detects order blocks on the chart's native timeframe
- HTF1 & HTF2: Two customizable higher timeframes (default: 60m, 240m)
- Independent Toggles: Enable/disable each timeframe's OBs separately
Smart Order Block Logic
- Long Order Blocks: Formed when current candle's LOW > middle candle's HIGH
- Short Order Blocks: Formed when current candle's HIGH < middle candle's LOW
- Persistent Display: Boxes extend until price fills the zone
- Color Coding:
- Current TF: Green (long) / Red (short)
- HTF1: Orange (long) / Maroon (short)
- HTF2: Blue (long) / Purple (short)
Swing Point Integration
-Swing Lows (SWL) & Swing Highs (SWH): Automatically detected using pivots
-Validation Overlay: Highlights order blocks that coincide with swing points
- Lime boxes: Long OBs with SWL confirmation
- Fuchsia boxes: Short OBs with SWH confirmation
Visual Elements
- Order Block Boxes: Semi-transparent zones with bold borders
- Entry Markers: Triangle shapes below/above bars for visual confirmation
- Swing Labels: SWL/SWH labels at pivot points
- Valid OB Overlay: Distinctive colored boxes for validated zones
⚙️ Input Parameters
Display Controls
- `Show Long OBs`: Toggle long order block display
- `Show Short OBs`: Toggle short order block display
- `Show Current TF OBs`: Display order blocks from current timeframe
- `Use HTF1/HTF2 OBs`: Enable higher timeframe order blocks
- `HTF1/HTF2`: Customizable timeframe strings
Technical Settings
- `My Input`: Maximum unfilled boxes to display (50-50000, default: 1000)
- `Swing Lookback / Forward Length`: Pivot detection sensitivity (default: 10)
📊 How It Works
1. Order Block Detection: The indicator scans three timeframes for specific candlestick patterns that indicate potential supply/demand zones.
2. Swing Point Detection: Simultaneously identifies swing highs and lows using pivot logic.
3. Validation Overlay: When an order block forms on the same candle as a swing point, it creates a special highlighted zone indicating higher probability.
4. Memory Management: Automatically manages box count to prevent performance issues while maintaining historical context.
🎯 Trading Applications
- Trend Continuation: Validated order blocks in trend direction offer high-probability entries
- Reversal Zones: Swing-aligned order blocks at key levels suggest potential reversals
- Multi-Timeframe Analysis: Higher timeframe OBs provide stronger support/resistance
- Zone Trading: Trade bounces from or breaks through validated zones
💡 Usage Tips
1. Prioritize Validated Zones: Focus on lime/fuchsia boxes as they have swing confirmation
2. Timeframe Hierarchy: HTF2 (240m) > HTF1 (60m) > Current TF for zone strength
3. Combine with Price Action: Use zones alongside candlestick patterns and volume
4. Risk Management: Place stops beyond opposite side of order block
⚠️ Limitations
- Not a standalone trading system - combine with other analysis
- May repaint on current bar until close
- Higher timeframes require sufficient historical data
- Swing detection sensitivity depends on length parameter
---
Note: This tool is for educational purposes. Always practice proper risk management and backtest strategies before live trading.

T-DOW-FLOW: Final Edition
T-DOW-FLOW: Market Structure & Smart Pivot Zones
This indicator is a comprehensive technical analysis tool designed to visualize "Market Structure" based on Dow Theory and precise Supply/Demand Zones. It helps traders identify the true market trend and high-probability reaction levels by analyzing raw price action (ZigZag Pivots) rather than lagging indicators.
The script integrates three core systems:
ZigZag Trend Cloud: Visualizes the market bias (Uptrend/Downtrend).
Smart Pivot Zones (Type 1): Highlights the specific "Wick-to-Body" area of recent pivots.
Auto Density Channels (Type 2): Detects historical support/resistance clusters.
1. ZigZag Trend Identification
Logic: The script utilizes ta.highestbars and ta.lowestbars to detect Swing Highs and Swing Lows.
Trend Cloud:
If the structure creates a Higher High, the background cloud turns Green (Uptrend).
If the structure creates a Lower Low, the background cloud turns Red (Downtrend).
This provides an instant visual filter for "Trend Flow," encouraging traders to trade only in the direction of the dominant market structure.
2. SR Type 1: Smart Pivot Zones (Wick-to-Body)
Unlike standard indicators that draw thin lines at the absolute High/Low, this script focuses on the "Imbalance Zone".
It calculates the price range between the Pivot's Wick and the Pivot's Body (Open/Close) and fills this area with a colored zone.
Why? The area between the wick and body often represents the precise zone where institutional orders were filled, acting as a more reliable support/resistance level than a single price point.
3. SR Type 2: Auto Density Channels
This module scans a significant amount of historical data (default: 300 bars) to find clusters of pivot points.
Areas where multiple pivots align within a specific width are drawn as Channels. These represent strong, long-term psychological levels.
Trend Filter: Check the Trend Cloud color.
Green: Look for Long opportunities.
Red: Look for Short opportunities.
Entry Trigger: Wait for the price to retrace into a Smart Pivot Zone (Type 1) or an Auto Channel (Type 2).
Look for price rejection (wicks) at these zones in the direction of the Trend Cloud.
Structure Confirmation: Use the ZigZag lines and labels (HH, HL, etc.) to confirm that the market structure is still intact before entering.
ZigZag Settings: Adjust the sensitivity of the trend detection.
SR Type 1: Toggle the "Wick-to-Body" fill and choose between Wicks or Bodies as the primary source.
SR Type 2: Adjust the historical loopback period and channel width sensitivity.
This script is for educational and technical analysis purposes only. Past performance does not guarantee future results.
(以下、日本語説明 / Japanese Description)
このインジケーターは、「ダウ理論」に基づくトレンド判定と、精密な「需給ゾーン(Supply/Demand)」を可視化するための市場構造分析ツールです。 遅行指標を使わず、純粋なプライスアクション(ZigZagピボット)に基づいて、機関投資家の意識する価格帯を特定します。
1. ZigZagトレンドクラウド
ロジック: 一定期間の高値・安値を検出し、ダウ理論に基づいてトレンドを判定します。
視覚化: 高値切り上げ(上昇トレンド)なら「緑」、安値切り下げ(下落トレンド)なら「赤」の背景色を表示します。これにより、トレードすべき方向(順張り)を一目で判断できます。
2. SR Type 1: スマートピボットゾーン (Wick-to-Body)
単なる水平線ではなく、ローソク足の**「ヒゲ先」から「実体」までの価格差**をゾーンとして塗りつぶして表示します。
理由: ヒゲと実体の間の領域は、大口の注文が執行された(需給の不均衡が発生した)重要なエリアであることが多く、ピンポイントのラインよりも信頼性の高い反発ゾーンとして機能します。
3. SR Type 2: オート・デンシティ・チャネル
過去の長期間(デフォルト300本)のデータをスキャンし、ピボットが密集している価格帯を自動で「チャネル」として描画します。長期的に意識される強力なレジサポ帯です。
環境認識: 背景のトレンドクラウドの色に従い、目線を固定します。
エントリー: 価格がSRゾーン(Type 1)やチャネル(Type 2)に引きつけて、反発する動きを確認してエントリーします。
構造確認: ZigZagラインとラベル(HH/HLなど)を見て、トレンドが崩れていないことを確認します。

Price Volume Heatmap [MHA Finverse]Price Volume Heatmap - Advanced Volume Profile Analysis
Unlock the power of institutional-level volume analysis with the Price Volume Heatmap indicator. This sophisticated tool visualizes market structure through volume distribution across price levels, helping you identify key support/resistance zones, high-probability reversal areas, and optimal entry/exit points.
🎯 What Makes This Indicator Unique?
Unlike traditional volume indicators that only show volume over time, this heatmap displays volume distribution across price levels , revealing where the most significant trading activity occurred. The gradient coloring system instantly highlights high-volume nodes (areas of strong interest) and low-volume nodes (potential breakout zones).
📊 Core Features
1. Dynamic Volume Heatmap
- Visualizes volume concentration across 250 customizable price levels
- Gradient color scheme from high volume (white) to low volume (teal/green)
- Adjustable brightness multiplier for enhanced contrast and clarity
- Real-time updates as market conditions evolve
2. Point of Control (POC)
- Automatically identifies the price level with the highest traded volume
- Acts as a magnetic price level where markets often return
- Critical for identifying fair value areas and potential reversal zones
- Customizable line style, width, and color
3. Flexible Lookback Settings
- Lookback Bars: Set any value from 1-5000 bars to control analysis depth
- Visible Range Mode: Analyze only what's currently visible on your chart
- Timeframe-Specific Settings: Different lookback periods for 1m, 5m, 15m, 30m, 1h, Daily, and Weekly charts
- Adapts to your trading style - scalping to position trading
4. Session Separation Analysis
- Tokyo Session: 00:00-09:00 UTC
- London Session: 07:00-16:00 UTC
- New York Session: 13:00-22:00 UTC
- Sydney Session: 21:00-06:00 UTC
- Daily Reset: Analyze each trading day independently
Session separation allows you to understand volume distribution specific to each major trading session, revealing institutional order flow patterns and session-specific support/resistance levels.
5. Profile Width Options
- Dynamic: Profile width adjusts based on lookback period
- Fixed Bars: Set a specific bar count for consistent profile width
- Extend Forward: Project the profile into future bars for planning trades
6. Smart Alerts
- POC crossover/crossunder alerts
- New session start notifications
- Never miss critical price action at high-volume nodes
📈 How to Use This Indicator Professionally
Understanding Market Structure:
High Volume Nodes (HVN):
- Appear as bright/white areas in the heatmap
- Represent price levels where significant trading occurred
- Act as strong support/resistance zones
- Markets often consolidate or bounce from these levels
- Trading Strategy: Look for entries when price tests HVN areas with confluence from other indicators
Low Volume Nodes (LVN):
- Appear as darker/teal areas in the heatmap
- Represent price levels with minimal trading activity
- Price tends to move quickly through these areas
- Often form "gaps" in the volume profile
- Trading Strategy: Expect rapid price movement through LVN zones; avoid placing stop losses here
Point of Control (POC):
- The single most important price level in your analysis window
- Represents the fairest price where maximum volume traded
- Price gravitates toward POC like a magnet
- Trading Strategy:
* When price is above POC: bullish bias, POC acts as support
* When price is below POC: bearish bias, POC acts as resistance
* POC breaks often lead to significant trend changes
Session-Based Analysis:
Use session separation to understand how different market participants trade:
Asian Session (Tokyo/Sydney):
- Typically lower volatility and range-bound
- Volume profiles often show tight, balanced distribution
- Use for identifying overnight ranges and gap fill zones
London Session:
- Highest volume session for forex pairs
- Often shows strong directional bias
- Look for breakouts from Asian ranges during London open
New York Session:
- Maximum participation when overlapping with London
- Institutional order flow most visible
- POC during NY session often becomes key level for following sessions
🎯 Practical Trading Applications
1. Identifying Support & Resistance:
High volume nodes from the heatmap are far more reliable than traditional swing highs/lows. When price approaches an HVN, expect reaction - either a bounce or a significant breakout if breached.
2. Trend Confirmation:
- Healthy uptrend: POC rising over time, HVN forming at higher levels
- Healthy downtrend: POC falling over time, HVN forming at lower levels
- Consolidation: POC relatively flat, volume balanced across range
3. Breakout Trading:
When price breaks through a Low Volume Node with momentum, it often continues to the next High Volume Node. Use LVN areas as measured move targets.
4. Reversal Zones:
Multiple HVN stacking on top of each other creates a "volume shelf" - an extremely strong support/resistance zone where reversals are highly probable.
5. Risk Management:
- Place stops beyond HVN areas (not within LVN zones)
- Size positions based on distance to nearest HVN
- Use POC as trailing stop level in trending markets
⚙️ Recommended Settings
For Day Trading (Scalping/Intraday):
- Lookback: 200-500 bars
- Rows: 200-250
- Enable session separation for your primary trading session
- Profile Width: Dynamic or Fixed Bars (30-50)
For Swing Trading:
- Lookback: 500-1000 bars
- Rows: 250
- Session separation: Daily Reset
- Profile Width: Dynamic
For Position Trading:
- Lookback: 1000-3000 bars
- Rows: 250
- Use timeframe-specific settings
- Profile Width: Extend Forward (20-50 bars)
💡 Pro Tips
1. Combine this indicator with price action analysis - volume confirms what price is telling you
2. Watch for POC convergence with other technical levels (fibonacci, pivot points, moving averages)
3. Volume at extremes (tops/bottoms of heatmap) often indicates exhaustion
4. Session POC from previous sessions often acts as magnet for current session
5. Increase brightness multiplier (1.5-2.5) for clearer visualization on busy charts
6. Use "Number of Sessions to Display" to analyze consistency of volume levels across multiple sessions
🎨 Customization
Fully customizable visual appearance:
- Gradient colors for volume visualization
- POC line thickness, color, and style
- Session line colors and visibility
- All settings organized in intuitive groups
⚠️ Disclaimer
This indicator is a technical analysis tool and should not be used as the sole basis for trading decisions. Always combine volume analysis with proper risk management, fundamental analysis, and other technical indicators. Past performance does not guarantee future results.
---
Support & Updates
Regular updates and improvements are made to enhance functionality. For questions, suggestions, or bug reports, please use the comments section below.
Happy Trading! 📊💹

Gold 15m: Trend + S/R + Liquidity Sweep (RR 1:2)This strategy is designed for short-term trading on XAUUSD (Gold) using the 15-minute timeframe. It combines trend direction, support/resistance pivots, liquidity sweep detection, and momentum confirmation to identify high-probability reversal setups in line with the dominant market trend.
⚙️ Core Logic:
Trend Filter (EMA 200):
The strategy only takes long positions when price is above the 200 EMA and short positions when price is below it.
Support/Resistance via Pivots:
Dynamic swing highs and lows are identified using pivot points. These act as local supply and demand levels where liquidity is likely to accumulate.
Liquidity Sweep Detection:
A bullish liquidity sweep occurs when price briefly breaks below the last pivot low (grabbing liquidity) and then closes back above it.
A bearish sweep occurs when price breaks above the last pivot high and then closes back below.
Momentum & Candle Strength:
The strategy filters signals based on candle range and body size to ensure entries occur during strong price reactions, not weak retracements.
Risk Management (1:2 RR):
Stop-loss is placed slightly beyond the last pivot level using ATR-based buffers, and take-profit is set at 2× the risk distance, maintaining a reward-to-risk ratio of 1:2.
💼 Trade Logic Summary:
Long Entry:
After a bullish liquidity sweep & reclaim, momentum confirmation, and trend alignment (above EMA 200).
Short Entry:
After a bearish sweep & reclaim, momentum confirmation, and trend alignment (below EMA 200).
Exit:
Automated via ATR-based Stop Loss and Take Profit targets.
📊 Customization Options:
Adjustable EMA length, pivot settings, ATR multipliers, and RR ratio.
Option to enable/disable trend filter.
Toggle display of S/R zones on chart.
🧠 Best Use:
Works best during London and New York sessions when Gold shows strong momentum.
Can be adapted for forex pairs and indices by tuning ATR and pivot parameters.

Wolfe Waves [BigBeluga]🔵 OVERVIEW
The Wolfe Waves pattern was first introduced by Bill Wolfe , a trader and analyst in the 1980s–1990s who specialized in market geometry and natural rhythm cycles. Wolfe observed that price often forms symmetrical wave structures that anticipate equilibrium points where supply and demand meet. These formations, called Wolfe Waves , gained popularity as a reliable pattern for forecasting both short- and long-term reversals.
The Wolfe Waves indicator automatically detects these patterns in real time. It tracks sequences of five pivots (points 1 through 5) and connects them with wave lines. Users can select either Bullish or Bearish Wolfe Waves depending on their trading bias. When the pattern fails, the lines automatically turn red to highlight invalidation.
🔵 CONCEPTS
Five-Point Structure – Wolfe Waves are defined by five pivots (1–5), which together form the basis of the wave pattern.
Bullish Pattern – Occurs when price compresses downward into point 5, signaling a potential upside reversal.
Bearish Pattern – Occurs when price extends upward into point 5, forecasting a downside reversal.
Validation & Failure – The pattern is considered valid once all five pivots form; if price fails to respect the expected breakout, the indicator marks the structure as broken with red lines.
🔵 FEATURES
Automatic detection of Bullish and Bearish Wolfe Waves.
Labels each pivot (1–5) on the chart for clarity.
Draws connecting lines between pivots to visualize the wave structure.
Projects target/dashed lines (EPA/ETA) based on Wolfe Wave geometry.
Lines automatically turn red when the pattern is broken, giving immediate feedback.
Customizable color scheme for bullish (lime) and bearish (orange) waves.
Adjustable sensitivity for pivot detection.
🔵 HOW TO USE
Choose between Bullish or Bearish mode depending on your analysis.
Watch for the formation of all five pivots; the indicator labels them clearly.
Look for potential entries near point 5, with the expectation that price will travel toward the projected EPA line.
Use invalidation (lines turning red) as a risk management warning to exit failed setups.
Combine with momentum, volume, or higher-timeframe analysis to increase reliability.
🔵 CONCLUSION
The Wolfe Waves brings the classic Wolfe Wave theory into an automated TradingView tool. Inspired by Bill Wolfe’s original concept of natural market cycles, this indicator detects, labels, and validates Wolfe Waves in real time. With automatic invalidation marking and customizable settings, it offers traders a structured way to harness one of the most well-known geometric reversal patterns.

Multi-Tool Nasdaq US100 IndikatorA combination of several tools such as moving averages (EMA 50, 100, 200), Fibonacci retracements, pivot points, RSI (Relative Strength Index), order blocks, fair value gaps, supply and demand zones, and a simple volume profile.
The indicator is designed to enable high profitability by combining various established technical analysis approaches into one tool, facilitating decision-making regarding entry and exit points.
The script can be integrated and used directly in TradingView by creating a new indicator script and pasting the code there.

Fractal Pullback Market StructureFractal Pullback Market Structure
Author: The_Forex_Steward
License: Mozilla Public License 2.0
The Fractal Pullback Market Structure indicator is a sophisticated price action tool designed to visualize internal structure shifts and break-of-structure (BoS) events with high accuracy. It leverages fractal pullback logic to identify market swing points and confirm whether a directional change has occurred.
This indicator detects swing highs and lows based on fractal behavior, drawing zigzag lines to connect these key pivot points. It classifies and labels each structural point as either a Higher High (HH), Higher Low (HL), Lower High (LH), or Lower Low (LL). Internal shifts are marked using triangle symbols on the chart, distinguishing bullish from bearish developments.
Break of Structure events are confirmed when price closes beyond the most recent swing high or low, and a horizontal line is drawn at the breakout level. This helps traders validate when a structural trend change is underway.
Users can configure the lookback period that defines the sensitivity of the pullback detection, as well as a timeframe multiplier to align the logic with higher timeframes such as 4H or Daily. There are visual customization settings for the zigzag lines and BoS markers, including color, width, and style (solid, dotted, or dashed).
Alerts are available for each key structural label—HH, HL, LH, LL—as well as for BoS events. These alerts are filtered through a selectable alert mode that separates signals by timeframe category: Low Timeframe (LTF), Medium Timeframe (MTF), and High Timeframe (HTF). Each mode allows the user to receive alerts only when relevant to their strategy.
This indicator excels in trend confirmation and reversal detection. Traders can use it to identify developing structure, validate internal shifts, and anticipate breakout continuation or rejection. It is particularly useful for Smart Money Concept (SMC) traders, swing traders, and those looking to refine entries and exits based on price structure rather than lagging indicators.
Visual clarity, adaptable timeframe logic, and precise structural event detection make this tool a valuable addition to any price action trader’s toolkit.

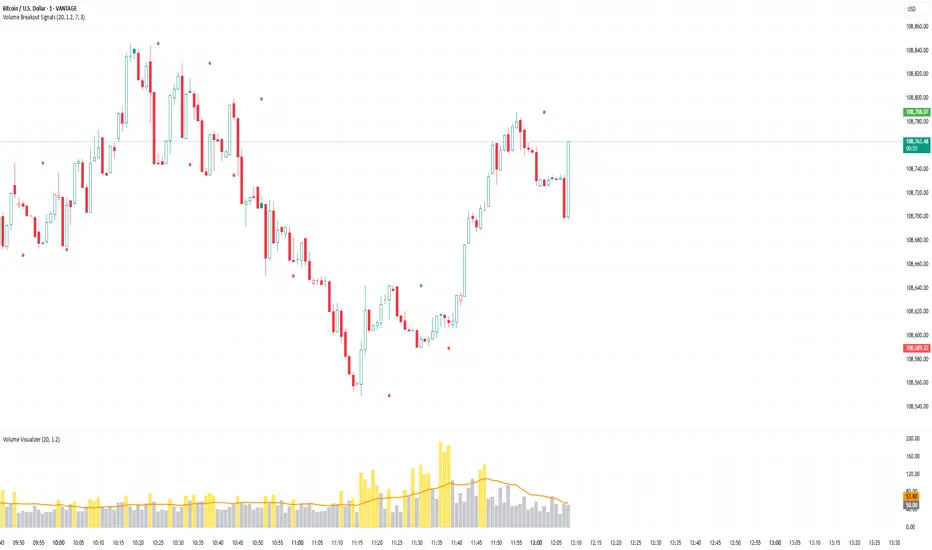
Volume Breakout SignalsScript by Hanssome
The Volume Breakout Signals indicator is a trading tool designed to identify potential entry points by pinpointing high-momentum price breakouts on your main chart. It operates on a simple but powerful principle: a true breakout should be supported by a significant increase in trading volume.
The indicator plots two primary visual elements on your price chart:
Pivot Highs and Lows: These are marked with green and red circles and represent the most recent significant swing points in the price. They act as dynamic support and resistance levels, and the script watches for the price to break past them.
BUY and SELL Labels: These signals appear directly on the chart to indicate a potential trading opportunity.
A signal is only generated when two specific conditions are met simultaneously:
Price Breakout: A BUY signal requires the price to cross decisively above the most recent pivot high. A SELL signal requires the price to cross below the most recent pivot low.
Volume Confirmation: This price breakout must be accompanied by a recent spike in trading volume. This confirmation suggests strong momentum and conviction behind the move, increasing the probability of a successful breakout.
All the parameters, such as the sensitivity of the pivot points and the definition of a volume spike, can be adjusted in the indicator's settings to fit your specific trading style and the asset you are viewing.